Crypto research
that shows its work.
We test market ideas on clean, survivorship-free data, then publish plain verdicts. Including the ideas that failed.
NewStudy 01: calm coins beat wild coins ›Alt Radar. Every alt against the market.
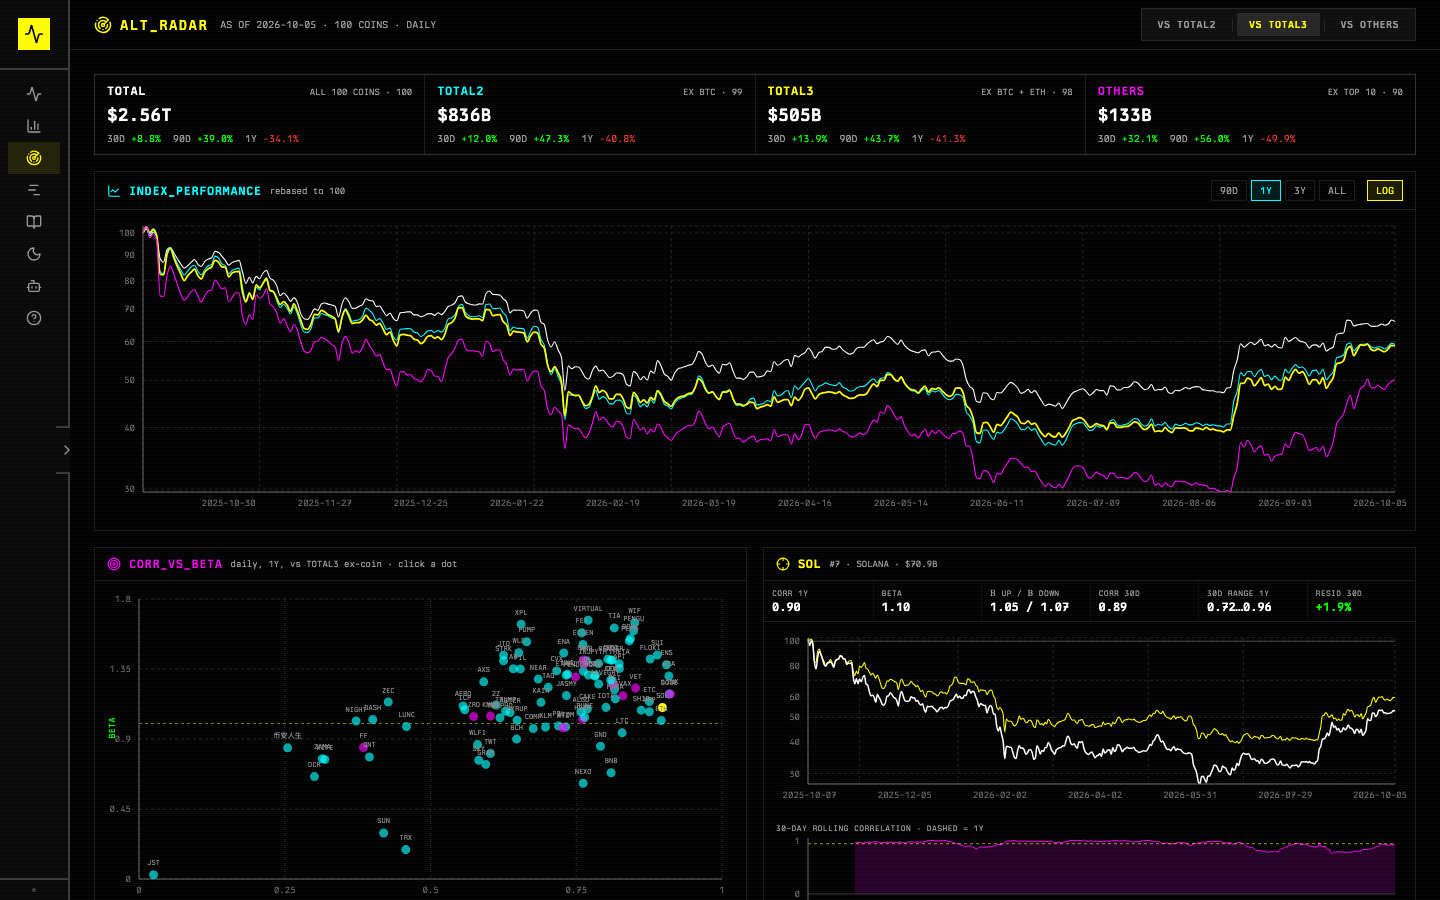
TOTAL, TOTAL2, TOTAL3 and OTHERS rebuilt from scratch, then each coin measured against them: how closely it follows, how hard it falls, and whether it's breaking away right now.
Rebuilt, not borrowed
Cap-weighted TOTAL indexes from exchange prices and supply, each checked against the published versions.
Leave-one-out
Each coin is compared with the index rebuilt without itself, so big coins don't grade their own homework.
Who's moving alone
When a coin's 30-day correlation breaks from its 1-year norm, it gets flagged.
Calm coins win. Here's where every coin sits.
Across: how wild each coin has moved over 30 days, compared with the rest. Up: its 30-day move. Since 2020, the calmest fifth beat the typical coin about two times in three. The wildest fifth, about one in three.
The lottery effect, on clean data.
Every day we ranked the 100 most-traded coins on Binance by how wildly they'd moved over the past month, then watched the next 30 days.
Wild coins feel like the opportunity. Most of the time they're the trap. A few moon, and those rare wins keep people buying lottery tickets.
It held every year, in bull and bear markets, and in two years we kept locked away until the end. The exception: real alt-season months.
View as table
| Year | Calm | Wild |
|---|
We publish the misses too.
Most research only shows the winners. Knowing what fails is half the edge.
| Idea | Tested on | What we found | Verdict |
|---|---|---|---|
| Calm beats wild | 680 Binance pairs, 2020–26 | Calm coins beat the typical coin 68% of the time in 2025–26, wild coins 32%. Held every year. | ✓ HOLDS |
| Bottoming signals | Same universe, exchange data | Coins with all three bottoming signs did worse than coins with none: 33–42% vs 44–47%. | ✕ FAILED |
| Chart fingerprints | 100 coins, hourly, 2021–26 | Shazam-style matching recognised charts 99% of the time. Its forecasts lost to simple rules. | ✕ FAILED |
| Mood gauges timing BTC | Funding, flows, breadth | No measure predicted BTC's direction over 7 or 30 days. | ✕ FAILED |
| Planetary cycles | BTC and alts, 2019–26 | No link to direction, 30–60 day mood, or alt season. The sign flipped year to year. | ✕ FAILED |
Dead coins count
Studying only today's survivors flatters everything. Our data includes every coin that was listed, then disappeared.
Rules before results
Tests are written down before they run, and the latest years stay locked away until the final check.
Plain verdicts
Holds, failed, or too early to tell. With the numbers, in words anyone can follow.
Get the weekly read.
One email a week · what changed, what we tested, what held